
Systemwide Procurement
Sustainability Spend Analysis – What the UC System Can Do Right Now
by Karen Cook, Sustainability Project Manager, County of Alameda, General Services Agency
When most people consider sustainable (or green) purchasing, they think about buying recycled content copy paper, or perhaps, green cleaning chemicals. These are great places to start when launching a sustainable purchasing program because these products have well developed markets and are cost-effective. But if you stop there, you may overlook many opportunities to have a bigger impact with your purchasing dollars.
Conducting a sustainable spend analysis can help determine which portions of spend are contributing the most to your organization’s climate footprint. It uses economic modeling tools to translate dollars spent into the greenhouse gas (GHG) emissions generated within your supply chain as a result of that spend. A sustainability spend analysis goes beyond just telling you where you spent your money – it highlights which goods and services have produced the greatest environmental impact. These areas, known as “hot spots,” hold the biggest opportunities to make a real difference with your purchasing power.
Conducting a spend analysis is no small feat. It requires pulling complete data from your procurement system, and dedicating the time and resources required to complete the analysis. These can be big barriers for many organizations, especially public institutions. To target supply chain opportunities in the public sector and higher education, the West Coast Climate and Materials Management Forum developed two helpful tools: a “How-To Guide” and a “Trends Analysis” report. Both are available in the Forum’s Climate Friendly Purchasing Toolkit.
The UC system can get started right away by using the Trends Analysis report to prioritize the high impact purchasing categories already identified as common among the 16 universities that have completed sustainability spend analysis for GHG emissions. These categories include: construction, lab and operating supplies, and food, lodging and transport related to student and faculty travel (see Figure 1 below).
Awareness of these higher education hot spots can lead to working cross-departmentally to develop sustainable procurement strategies that will reduce the impact of these activities. For example, the Capital Programs team is best positioned to address embodied carbon from construction activities, such as utilizing low-carbon concrete and reducing unnecessary idling on the job site. By partnering with the Procurement team, they can ensure proper sourcing of these materials and define RFP/contract specifications to drive optimal environmental performance.
When you consider that an organization’s purchasing can account for 35-55% of its total GHG emissions, it can really pay to conduct a procurement spend analysis or at least leverage the efforts of other similar organizations to understand and mitigate your likely hot spots. The Forum’s Climate Friendly Purchasing Toolkit is a great resource to guide you in both approaches. It also provides a number of case studies and strategies for addressing the environmental footprint of certain high impact purchasing categories. What have you got to lose – except numerous metric tons of carbon dioxide?
Figure 1: Percentage of total supply chain emissions, by organizational type, and purchasing category.
Note: Each column color on graph sums to 100%. The results presented in this analysis are based on a limited sample size. For a list of the organizations included in each organizational type, see Appendix B in report.
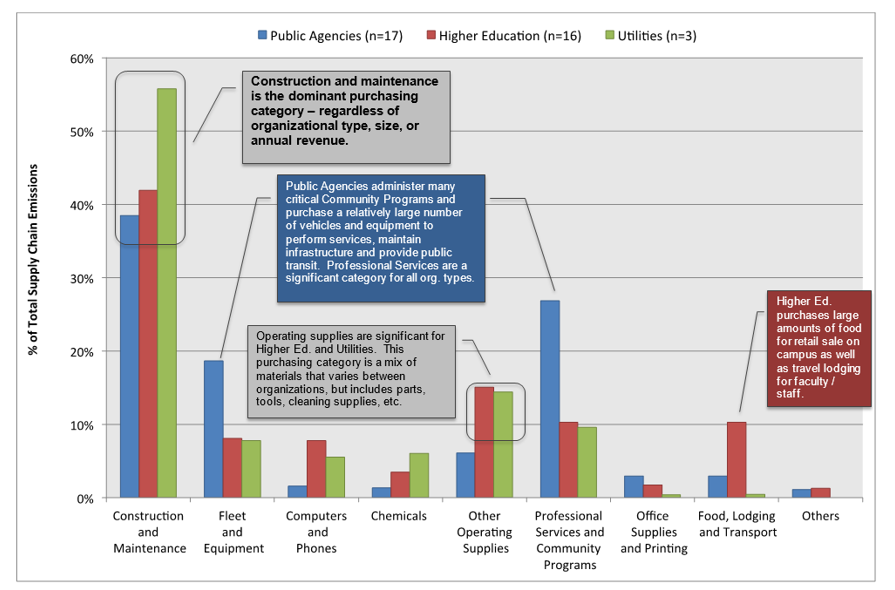
Source: Good Company on behalf of StopWaste (2015). Supply Chain Greenhouse Gas Inventory Meta-Analysis Retrieved 4/9/2018 https://westcoastclimateforum.com/cfpt/trendsanalysisintro