Enterprise Risk and Resilience
Risk Ranking Tool
This tool will help you consider the factors affecting the risks faced by your organization. The factors considered are:
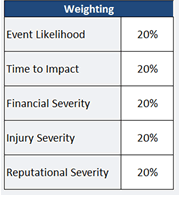
- Event Likelihood
- Time to Impact
- Financial Severity
- Injury Severity
- Reputational Impact Severity
The tool will prompt you to list potential risk events which may adversely impact your organization and describe the controls your organization has in place in order to manage or mitigate those risks. At each step, you will identify an appropriate scale for each factor associated with each risk, and then decide how effective your controls are in addressing that factor and that risk.
The purpose of this tool is not to ensure all risks are rated as "Adequately Controlled" but rather to help departments assess their control structure for sufficiency given their environment, resources, and bandwidth. This tool will not make decisions for you, but it will help you organize your thinking as you consider your organization's risk profile and related enterprise risk management implications.
The steps involved in completing this tool are outlined below, followed by additional notes.
- Get started
- Customize scales
- Identify potential risk events
- Estimate event likelihood
- Estimate time to impact
- Estimate financial severity
- Estimate injury severity
- Estimate reputational severity
- Review your risk ratings
- Review a chart of your risk events
- Export your data
Download a sample version of this tool (xlsx)
View the Risk Ranking Tool Webinar
The sample version should allow you to understand how this tool displays information, how to navigate through the steps, and what types of information you will need to complete it. However, it does not contain any formulas or calculations.
The full version of this tool is available free of charge as a public service and outreach effort of the UCOP Office of Risk Services. However, we do ask that you provide us with some basic information to assist us in understanding how this tool is being used. This helps us ensure we are continuously evolving the tools in our toolkit to meet the needs of our users.
If you would like a full version of this tool, please contact us at erm@ucop.edu with the following information:
- Your name and title
- Your organization
- Your phone number
- Your e-mail address
- The name(s) of the tool(s) you would like to use
- A brief description of how you intend to use the tool(s)
Getting Started
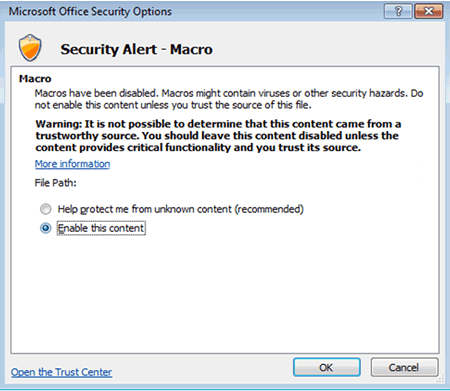
When you open the tool, you may be prompted with a warning indicating some content is unsecured. The tool only uses one macro, which allows the data export function to work. You will be able to fully utilize the tool even if you do not enable this macro; however, you will not be able to export the data without enabling it.
![]()
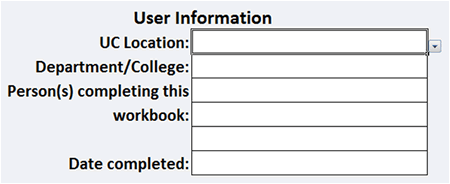
Next, fill in the employee names and organization information at the top of the first page. Then save the file in a secure location with an appropriate, unique name. This will minimize confusion if multiple files are created.
Then click the “Get Started!” button below the introduction to move on to the next step.
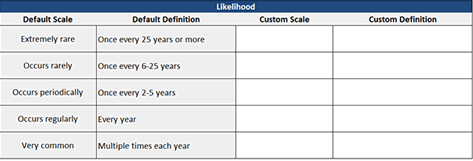
Customize Scales
Before you begin listing risks and assessing them, it's necessary to set some common definitions for the varying degrees of a risk's likelihood and various types of impacts. It's also important to set common parameters for evaluating the effectiveness of controls. Each scale can be customized to suit your organization’s risk appetite and structure.
Sample definitions are provided, but they can be modified to suit your needs. Anything you enter under "Custom Scale" will take the place of the "Default Scale" to its left. Only the scales you customize will be changed. The other default scales will remain in place. When you've completed this step, begin describing the program's objectives and assessing its risks on the pages linked below.
The five factors are weighted evenly at 20% each by default. Depending on the types of risk you are considering, those weights may change. For instance, if you are using this tool to consider risks that could cause workers’ compensation claims, you may weight event likelihood higher because there are statutes which limit the severity of most claims. If instead you are considering incidents involving employees and students interacting, where a small number of adverse events may have a significant impact, you may weight reputational severity higher.
The combined percentages must add up to 100%. As you move on to other steps, you can return to this page at any time by clicking the "Customize Scales" button.
Step 1: Identify Potential Risk Events
List potential risk events. Consider events that may result in injuries, loss of life, property damage, reputational damage, or other adverse impacts.
Formula Protection
Some cells on each page are protected to prevent accidental edits which may affect the tool’s calculations. Cells containing formulas are shaded a light grey. Spaces intended to be left blank are also shaded in the same light grey. Cells where you can enter information or make a selection from a drop-down menu are filled in white. Even for cells that are protected, you are able to format cells as you wish (change fonts, styles, colors, widths, heights, alignment, and text wrapping). These types of changes should be made without removing the protection on the page.
In further steps, if you decide to change the description of a risk, return to the Risk Assessment step and make the change there. The new description will then be reflected in the “Additional Controls” step.
Steps 2-6: Risk Assessment
In steps 2-6, the tool presents the risk and descriptions you created in step 1. Consider the specific aspect of the risk evaluated in each step (Event Likelihood, Time to Impact, Financial Severity, Injury Severity, and Reputational Severity). Next, apply the scale which most closely matches the appropriate aspect of the risk from the dropdown menu in the next columns. These should be rated assuming there are no controls in place. These selections are used in calculating the risk rating, and they use the scales you created in the previous page. The scales, including any custom scales you created, are listed at the left of each step’s page.
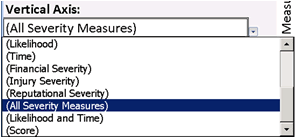
Chart of Events
This page displays the information you have entered into the tool in a chart. You can modify the information this chart displays with a wide range of flexibility.
The three dimensions of the chart are its vertical axis, horizontal axis, and the size of the bubbles. You can modify the type of information plotted on each axis or the bubble size by clicking in the boxes below the instructions and choosing the variable you wish to see.
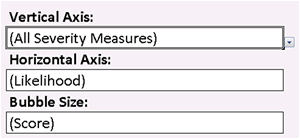
Dropdown selections in parentheses use figures calculated without controls. Selections without parentheses use figures calculated with the controls at the effectiveness you indicated in steps 2-6.
Summary
Once you have made your selections, the risk rating will be calculated and the "Risk Rating" field on the Summary page will populate with one of the values below.
| Risk Rating | Meaning |
|---|---|
|
Potentially over-controlled |
Management should review these risks to determine if controls need to be modified and make changes appropriately. |
|
Adequately controlled |
No immediate action is required. |
|
Potentially poorly controlled |
Management should review these risks to determine if controls need to be modified and make changes appropriately. |
|
Poorly controlled |
These risks should receive immediate attention. |
The rest of the summary page includes all of your selections at each step, as well as each risk and its description.
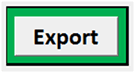
Exporting Your Data
When you have completed all of the steps, you may export the data into a comma-separated value file (.csv) for use in the University's Enterprise Risk Management Information System (ERMIS) by selecting the "Export" button on the Summary page.